* The figures are those of LAWSON and NATURAL LAWSON operated by Lawson, Inc.
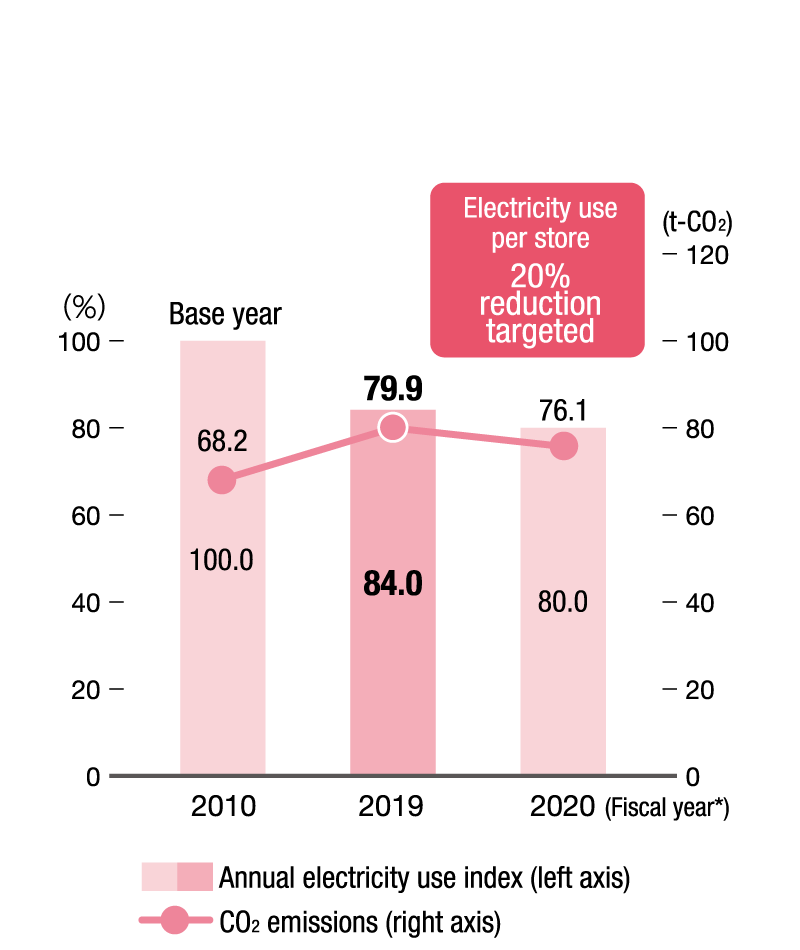
*Calculated from April 1 to March 31 of the following year to coincide with the administrative fiscal year
A reduction of 21.5% in fiscal 2019 compared with fiscal 2013
(The figures have been changed due to the change in the coefficient.)
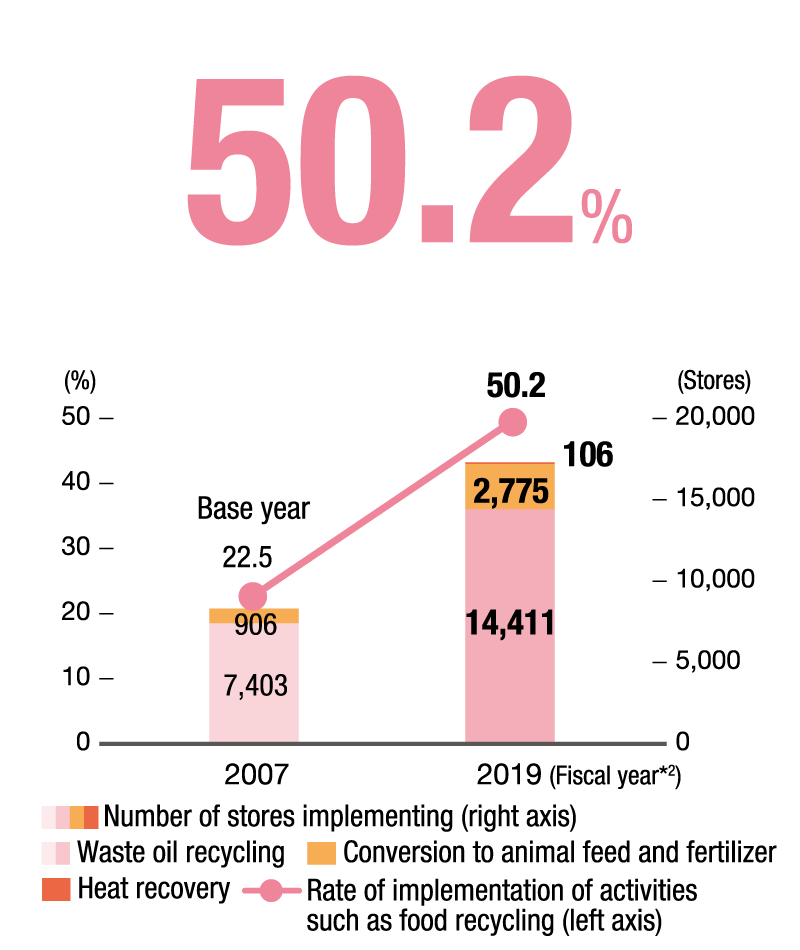
*1 The rate of food recycling does not include the figures of Lawson Okinawa, Inc., Lawson Minami-Kyushu, Inc., and Lawson Kochi, Inc.
*2 Calculated from April 1 to March 31 of the following year to coincide with the administrative fiscal year
*Excluding figures of LAWSON STORE 100
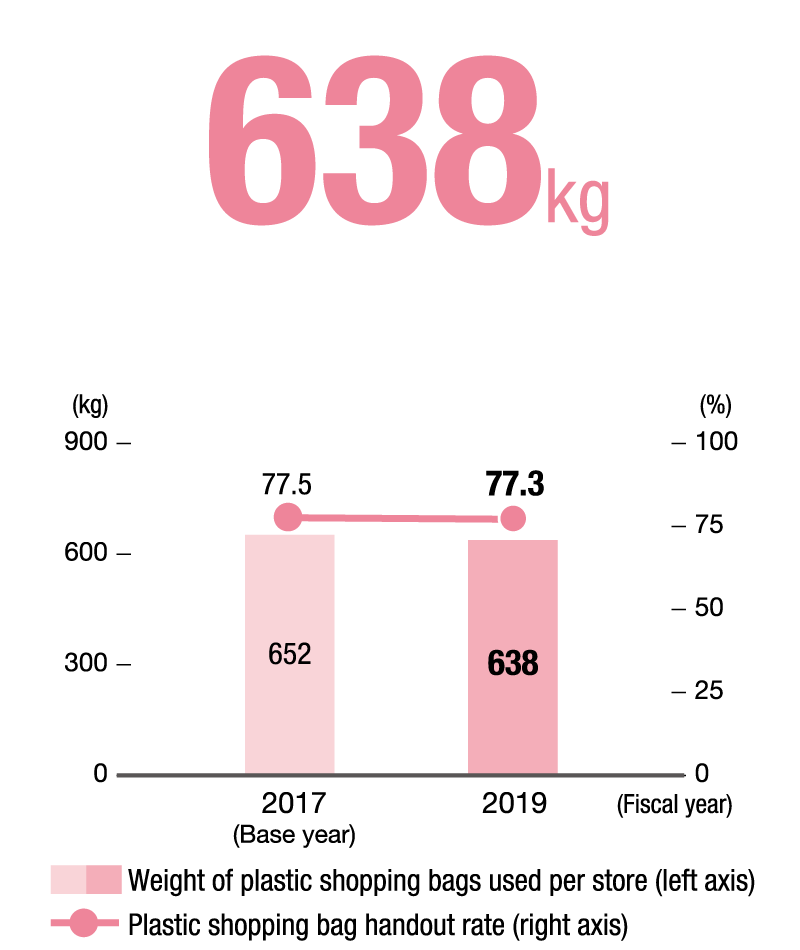
The rate of distribution of plastic shopping bags has become 25% (as of the end of August 2020) since July 1, 2020 (when charging for plastic shopping bags started).